Digital Humanities
DH2010
King's College London, 3rd - 6th July 2010
Capturing Visitor Experiences for Study and Preservation
See Abstract in PDF, XML, or in the Programme
Georgina Guy
King's College London
georgina.guy@kcl.ac.uk
Stuart Dunn
King's College London
stuart.dunn@kcl.ac.uk
Nicolas Gold
King's College London
nicolas.gold@kcl.ac.uk
The Courtauld Gallery occupies a unique position in central London as a university art museum and key facilitator for collaborative opportunities between research academics and curatorial practitioners. Given the context of the gallery as an institution housed within a building not purpose-built for the function of exhibition, the ways in which the gallery space acts as a directive on visitors’ viewing patterns is of particular interest. This paper introduces a methodology of documenting and visualizing those patterns.
The research is approached from the perspective of a performance specialist (Guy), investigating the curated gallery as a place for performance and the visitors’ role within such exhibition spaces. This has led to the generation of questions vital to new methodological approaches for exploring data only existent in the form of events, and to future processes of gallery operation and evaluation.
This paper focuses on the empirical aspects of this work, reporting on a project to create digital objects, displayable in Virtual World platforms such as Google Earth, from the experience of visitors to the Courtauld Gallery, London. The digital objects consist of visualisations in virtual space and time of visitor experiences, documented in KML, and represented using the Google Earth platform.
Studying Visitor Experiences
To date, the evaluation of exhibitions has largely been based on attendance numbers, with very little attention given to actual visitor behaviours within gallery environments. Traditionally, where visitor behaviours have been observed, methods for achieving this have been based on pen and paper recording using methods such as those developed by Space Syntax (Space Syntax, 2010). Capturing this data in digital form will allow a more thorough and formal analysis of the ‘success’ of exhibitions by permitting the replay in both time and virtual space of visitors’ behaviours and their interaction with staff, other visitors, and gallery exhibition materials. More specifically, we are concerned with:
- patterns of movement within gallery spaces
- specific pathways constructed by individual visitors through the museum
- duration of engagement with individual exhibits
- actions and interactions of gallery visitors
This information makes possible an analysis of how visitors explore exhibitions that is not preconceived but observed. Anonymous representations of visitor behaviours can be offered back to the gallery prompting curatorial assumptions to be validated or, where appropriate, reconsidered in light of evidential data about real patterns of visitor behaviour. This, in turn, can have important implications for maximizing public engagement within exhibition contexts and ensuring efficiency of interaction between staff and visitors, as well as other aspects of social and economic exchange. Using geovisualization techniques to generate the interactive maps based on individual experience raises questions about how possible it is to produce and manage the documentation of human behaviour.
Technological and Methodological Issues
Ideally, visitors would be totally oblivious to the data capture process or at least, such technological means as are necessary for capture would be non-intrusive. The demands of the research problem require high fidelity of location, orientation, and behaviour making the technological issues more complex than simply determining approximate location. Borriello et al. (2005) report that GPS systems do not work reliably inside buildings, wi-fi systems require calibration and achieve accuracy of only about 3 metres, and others require infrastructure installation. This is rarely possible in protected buildings such as the Courtauld, especially on a temporary basis. Consequently, the method described below was developed (related approaches will be discussed in presentation).
A pilot study was carried out prior to the main observation period in the Courtauld’s Frank Auerbach exhibition (Courtauld Gallery, 2009).
Data Capture Method
The method used is predominantly based on field observation in two forms. These approaches are influenced by the observation methods used by Space Syntax, a company with an established history of evidence-based design and evaluation for buildings and urban spaces. Space Syntax observations are undertaken using pen and paper.
The first method involves a human observer tracking the movement pattern of visitors around parts of the gallery in order to observe particularized routes specific to individual visitors. This is facilitated by the use of Tablet PCs and custom-developed software which displays an editable floor plan of the gallery, divided into map tiles based on the gallery rooms. In the case of the Courtauld, the map tiles are 610x365 pixels. The actual room size in the pilot is approximately 1290.5cm x 772cm = 12.9x7.7m. By moving the digital pen around the image the pathway of an individual can be recorded on the map and the movement documented with an x,y pixel reference and a timestamp. Duration and location are recorded both when the visitor is moving and stationary. Additional coding concerning, for example, the activity undertaken at any given moment, such looking at a map or signage or taking a photograph, can also be coded against points on each pathway.
The second method involves participants being asked to complete an exit questionnaire detailing their familiarity with the specific gallery and exhibits as well as more general experience of exhibition environments. This information is cross-referenced to the trace of each visitor’s pathways.
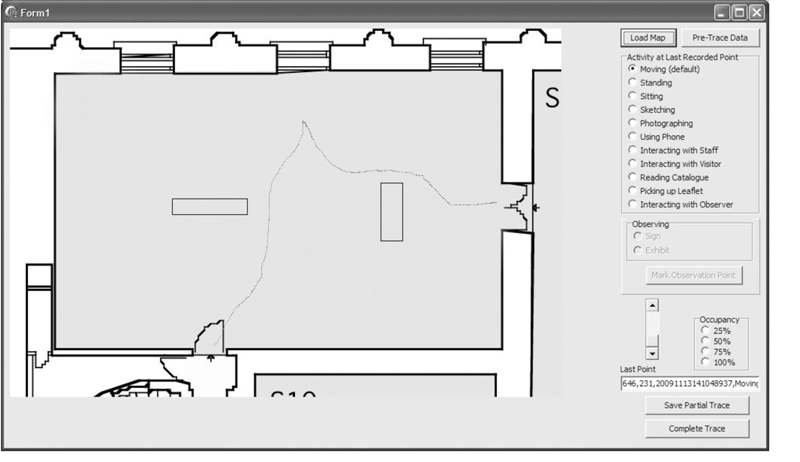
A screenshot from the software can be seen in Figure 1, showing a gallery floorplan with a partial trace. Figure 2 shows the simple comma separated values (CSV) data produced by the trace activity in realtime (the fields being X, Y, timestamp, visitor activity, and map file used). The system defaults to tracking movement as the pen is drawn across the screen, however, the observer can simply switch the “mode” of the current point by selecting one of the buttons to the right. Where data about interaction with an exhibit is necessary, the point of the observee’s interest can be noted by simply pointing at it on the diagram after selecting either “Sign” or “Exhibit” as the object of interest. The final system was developed in Borland Turbo Delphi with early prototyping undertaken in Processing.
For the Courtauld case study, the maps are scaled such that 1 pixel is approximately 2cm2 of real gallery space. The maps are converted from architectural plans and the location and size of furniture in the gallery included from measurement in the galleries themselves. Visitor location is recorded as a relative pixel position from the top left corner of the image. After capture this data can be transformed to generate real visitor positions in the room for subsequent visualisation.
-
- Figure 1: Screenshot from Data Capture Application
-
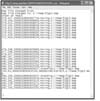
- Figure 2: Extract from CSV data file

Visualisation of Results
The relative positional information in the CSV file(s) is converted to absolute positions and stored in KML. The timestamp stream that indicates where a visitor was at a given time can be used to generate a trace of movement (and speed).
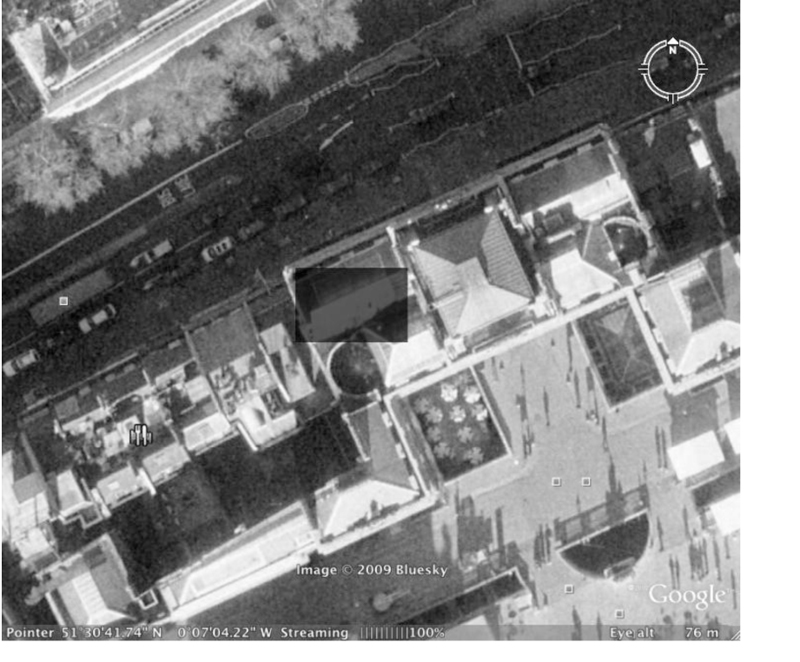
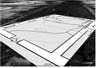
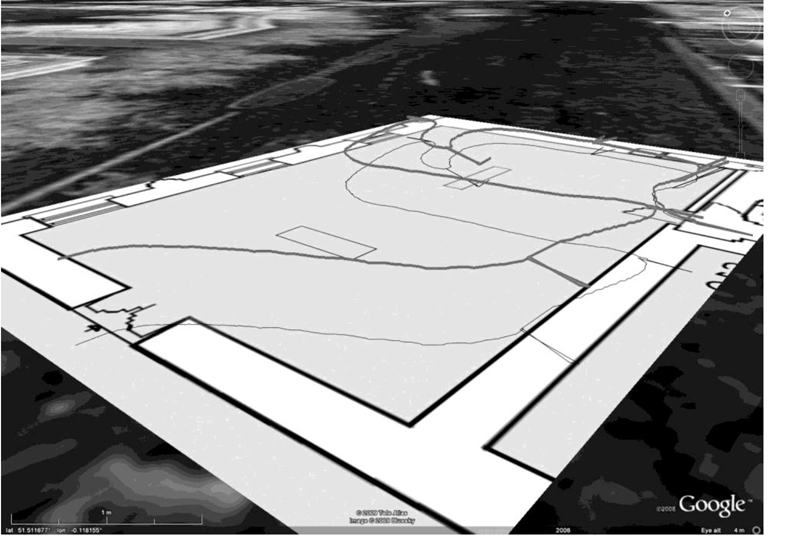
For the purposes of the visualization, the floorspace of the Auerbach, as defined by the map tiles in the data capture software, was rotated from its SE-NW alignment (see Figure 3). This was necessary to facilitate the georeferencing, or conversion of the x,y pixel data points into decimal degree coordinates. It was therefore possible to make the observation that the gallery room equated to 0.000118 x 0.000027 decimal degrees. The pixel readings (r)_ can therefore be converted to decimal degrees (d) using the simple conversion formula d=W. longitude – (0.000118/610)*r. For the latitude readings, this is repeated, but substituting (0.000027/325). An arbitrary altitude value, starting at 0.001 at the first reading, and increasing sequentially by 0.001 throughout the CSV dataset was added to the datapoints. In the visualization (see Figure 4), this gives the impression of the pathway rising as the visitor progresses through the gallery and through time: in this, it follows the principle of the ‘space time cube’, developed elsewhere (Kraak, 2008). As more data is added, this will allow us to build complex structured visualizations, which will add significant support to interpreting the visitors’ uses of, and interactions with, the space. These will be reported in full in the full presentation of this paper.
Conclusion
At the time of writing, the technology platforms are fully developed, ready for use and have been tested (with subsequent enhancement) in a pilot session in the gallery. The main observations will take place in November and December 2009 during the Courtauld Gallery’s exhibition of Frank Auerbach: London Building Sites 1952–62.
This paper has presented an approach to capturing visitor experience and interactions in a gallery using methods based on tried and tested approaches, but augmented by digital tools. The data generated can subsequently be visualised in virtual space and time to allow questions of performance practice to be addressed.
-

- Figure 3: The Auerbach gallery in Google Earth, and the area of the map tile on which the trace was taken, aligned on a N-S bearing. (© 2009 Google, Image © 2009 Bluesky)
-
- Figure 4. Representation of visitor pathway from the pilot study in ‘space time cube’ format, represented in Google Earth. (© 2008 Google, Map Data © 2009 Tele Atlas, Image © 2009 Bluesky)
References
- Boriello, G., Chalmers, M., LaMarca, A. and Nixon, P. (2005). 'Delivering Real-World Ubiquitous Location Systems'. Communications of the ACM. 48(3): 36-41
- Courtauld Gallery. 2009.. http://www.courtauld.ac.uk/gallery/exhibitions/2009/auerbach/index.shtml (accessed 3rd March 2010)
- Kraak, M.-J. (2008). 'Geovisualization and Time - New Opportunities for the Space-Time Cube'. Geographic Visualization: Concepts, Tools and Applications. Dodge, M., McDerby, M. and Turner. M. (eds.). London: Wiley
- Space Syntax. 2010. . http://www.spacesyntax.com (accessed 3rd March 2010)
© 2010 Centre for Computing in the Humanities
Last Updated: 30-06-2010