Digital Humanities
DH2010
King's College London, 3rd - 6th July 2010
A Platform for Cultural Information Visualization Using Schematic Expressions of Cube
See Abstract in PDF, XML, or in the Programme
Saito, Shinya
Postdoctoral Fellow, Digital Humanities Center for Japanese Arts
and Cultures Ritsumeikan University, Kyoto, Japan
saitos@fc.ritsumei.ac.jp
Ohno, Shin
Research Assistant, Digital Humanities Center for Japanese Arts and
Cultures Ritsumeikan University, Kyoto, Japan
shinohno@gmail.com
Inaba, Mitsuyuki
Digital Humanities Center for Japanese Arts and Cultures
Ritsumeikan University, Kyoto, Japan
inabam@sps.ritsumei.ac.jp
In recent years, people have tended to be overwhelmed by a vast amount of information in various contexts. Therefore, arguments about "Information Visualization" as a method to make information easy to comprehend are more than understandable.
This paper will argue the method of visualization of vast amount of information using 3-D viewer, and we will introduce an environment called KACHINA CUBE (KC) that can visualize various information using a “cube”. We have introduced KC in DH2009 (Saito, Inaba and Ohno, 2009). Then, we limited the use of KC to geographic information. But now, KC can adopt not only geographic information but also various events. In this paper, we introduce KC’s new design and function.
Design Concept of KC
Visualization Design
The most important thing in this research is to develop a Web system to integrate a large quantity of fragmentary information and to construct a method for visualizing a "scheme of things". For this purpose, we need to place all fragmentary information in the same context. Moreover, we have to come up with a way to put various information in a cube.
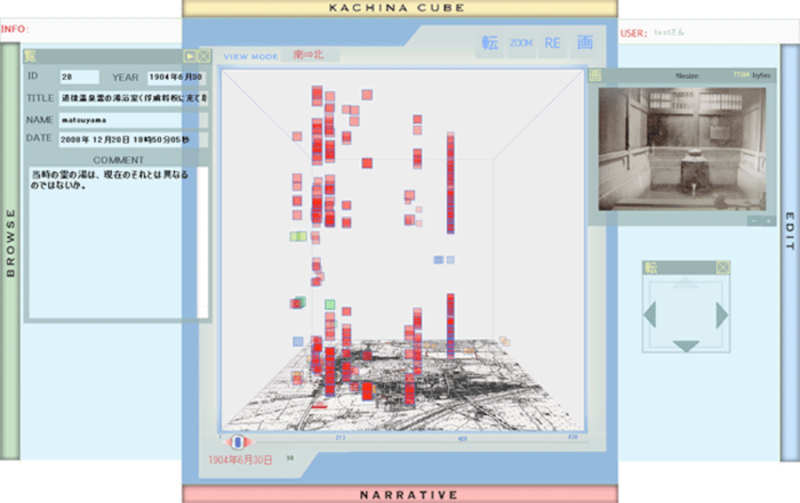
We decided to design KC in three dimensions, two dimensions for geographical information and another one for temporal information (see Fig. 1). In this virtual 3D space (CUBE model), users can post formal and informal story fragments and can spin the cube (see Fig. 2). Among them, we call formal ones history fragments, and informal fragments story ones. KC also supports researchers to make linkages among fragments in periodical or logical order. We call a set of cultural fragments a storyline.
We are developing KC’s search-engine for the most appropriate word. A fragment highlighted means that it includes the search term. Moreover, if there is more than one appropriate fragment, a line is drawn among those fragments. This function helps to find a hidden context or story among fragmented information. When words are searched and some words have a logical conjunction, multiple lines are drawn, as well as color-coded, based on the number of matched words. This search function thus makes visible the degree of connection among fragments.
-

- Fig 1. Application of CUBE Model for geographic information
-
- Fig 2. Rotation of cube

Sharing Design
W3C puts tremendous efforts to create standardized frameworks for Web, and researchers in digital humanities regard semantic web technology as one of the key research fields. This kind of technology gives us various chances to share data for other use. We believe archived cultural data should be standardized to fit in this framework, which allows users to access data and utilize them in various platforms.
We apply RDF/OWL to define our data. Its extensive and flexible definition is suitable for our system and motivates other researchers to access our data (Bray, 2001).
- History fragment class: Objective information in textbook or dictionary
- Story fragment class: Subjective information such as oral history
- Storyline class: Aggregate of historical and story fragments based on a specific context
- Geography class: Geographical information of the historical and story fragments
- Temporal class: Time when the incidents told in historical and story fragments occurred
Conceptual map Design
KC can adopt not only geographic information but also various events. In order to handle non-geographical information, KC supports conceptual maps. Moreover, the way in which a conceptual map is made should be considered. A conceptual map is a figure which expresses a development of story or event. We decided to apply the Trajectory Equifinality Model (TEM) to the process of making conceptual map. TEM is a theory to capture a certain phenomenon from view point of “time” and “process” (Valsinar and Sato 2006).
Moreover, KC is a web-based application that is built on the client-server architecture. In this system, client side application is implemented using ActionScript. On the other hand, server side application is developed by using PHP (PHP: Hypertext Preprocessor). KC adopts MySQL as a relational database management system.
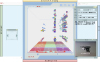
-
- Fig 3. Conceptual map of a muder case
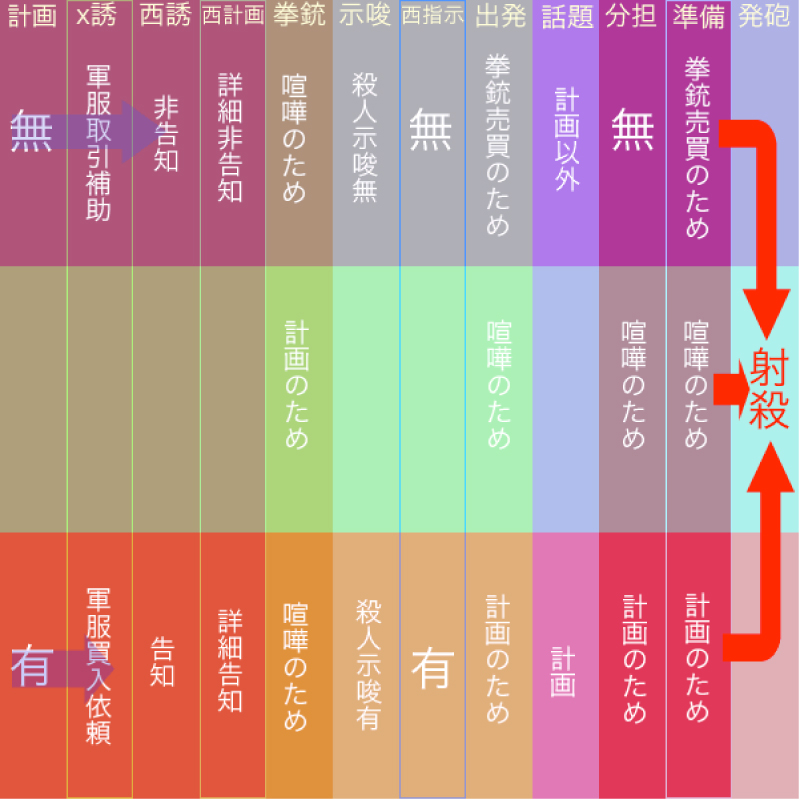
Below is an example of making a conceptual map using TEM. Fig.3 is a conceptual map to visualize a process of investigation and trial of a certain actual murder case. This conceptual map expresses both the process of the murder case itself and its trial. The map’s 12 columns represent development of this murder case; and 3 rows, the statements in the court of the defendant and prosecution. The defendant's statements are set on the top, while that of prosecution on the bottom. Moreover, statements that are pertinent to neither the top nor the bottom are set in the middle.
Fig.4 shows a result of this visualization with KC. This system is suitable to grasp the perspective on complicated cases which include multiple statements, stories, or contexts.
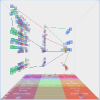
-
- Fig 4. Visualization of the possess of trail

All that has to be done is to prepare conceptual maps, after which this method can be applicable to numerous cases in the humanities fields. For instance, by using this method, we are trying to visualize argumentation about certain literary efforts.
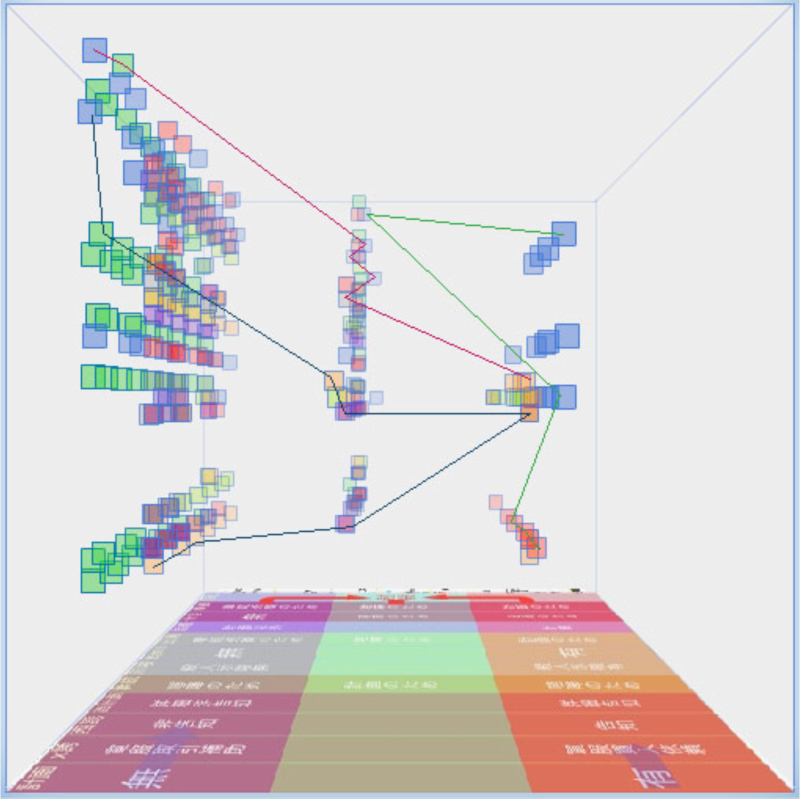
Moreover, using visualization of search results function, we tried to find fragments which include "拳銃 (gun)", "お金 (money)", "警察 (police)". As a result, three lines colored here in red, blue, and green appear (see Fig.5).
The red line means fragments which include "gun"; the blue, fragments with both "gun" and "money"; and the green, fragments which include all of "gun", "money" and "police". That is, the green line which includes all of the three shows the strongest tie.
Using this function allows not only us to extract fragments based on the given words, but also to detect some connections among information as well as their strength. Because of this function, it is possible to conduct text-mining through visual interface.
Conclusions and prospects
-
- Fig 5. Visualization of search results
As a result, our system demonstrates a lot of potential for research in various fields, which we have to prove by developing further this software with applications, as well as examining it in more humanities case studies. Our KC is significantly different from these previous Web systems in the following three points:
- Adoption of CUBE model (a 3D-viewer that combines the map with the timeline);
- Implementation of a user interface suitable to contain a vast amount of information;
- Implementation of analysis components for narratives and oral histories
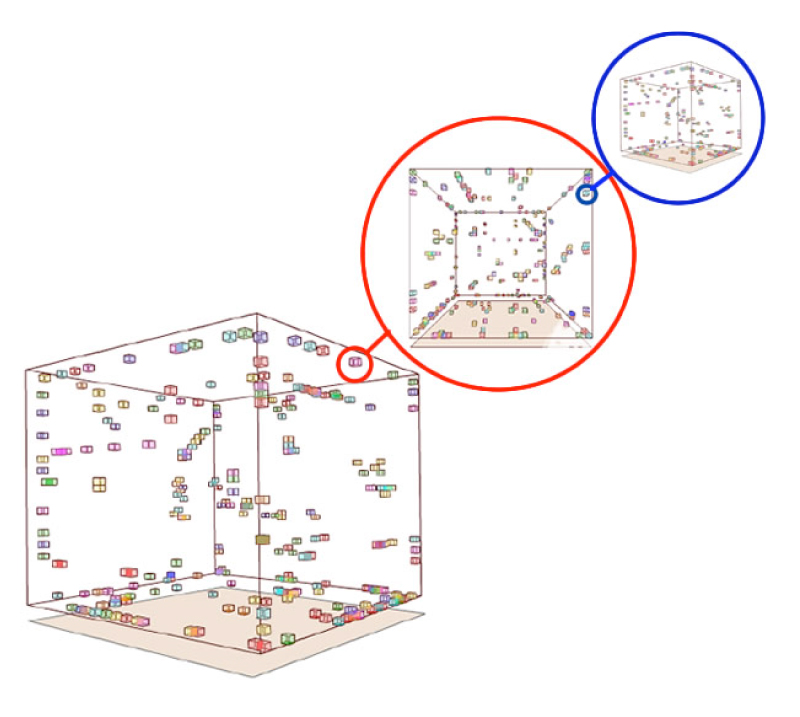
We are trying to implement some new functions now, among which the most drastic is the "nesting cube" structure. All fragments in the KACHINA CUBE are defined as independent cubes in this structure. Furthermore, we can make a recursively-defined cube severalfold by using this function. Because of this, a large amount of information can be organized hierarchically.
For example, "England" could be set as a cube on the highest layer (root layer). Moreover, a cube of "Liverpool" can be set in "England". In "Liverpool", a cube of "The Beatles" might be attached. Therefore, it may include a cube of "John Lennon". Each cube can include any piece of information of the same level as a cube. This architectonics can change ways of organizing and browsing information fundamentally and support visualizing of a "scheme of things" very well. At the same time, we hope this architectonics will contribute greatly to Digital Humanities.
-
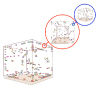
- Fig 6. Nesting cube structure
References
- Saito, S., Ohno, S. and Inaba, M. (2009). 'Collective Culture and Visualization of Spatiotemporal Information'. Proceedings of Digital Humanities 2009. University of Maryland, USA (22-25 June 2009), pp. 248-250
- Bray, T. (2001). What is RDF?. http://www.xml.com/pub/a/2001/01/24/rdf.html (accessed 14 November, 2008)
- Valsiner, J. and Sato, T. (2006). 'Historically Structured Sampling (HSS): How can psychology’s methodology become tuned in to the reality of the historical nature of cultural psychology?'. Pursuit of meaning. Advances in cultural and cross-cultural psychology. Straub, J. and et al. (eds.). Bielefeld: Transcript Verlag, pp. 215-251
© 2010 Centre for Computing in the Humanities
Last Updated: 30-06-2010