Digital Humanities
DH2010
King's College London, 3rd - 6th July 2010
Visualization and Analysis of Visiting Styles in 3D Virtual Museums
See Abstract in PDF, XML, or in the Programme
Sookhanaphibarn, Kingkarn
Intelligent Computer Entertainment Laboratory Global COE Program in
Digital Humanities for Japanese Arts and Cultures Ritsumeikan
University
kingkarn@ice.ci.ritsumei.ac.jp
Thawonmas, Ruck
Intelligent Computer Entertainment Laboratory Global COE Program in
Digital Humanities for Japanese Arts and Cultures Ritsumeikan
University
ruck@ci.ritsumei.ac.jp
A virtual museum is a cyberspace in persistent virtual worlds, such as Second Life, for displaying digitalized heritage documents. Urban et. al. (2007) reported that over 150 sites in Second Life (SL) were developed for education and museum activities. Virtual museums in SL offer visitors opportunities to engage in opening art exhibitions, discuss with specialists, and enjoy exploring collections of the wide range of artifacts. Those artifacts displayed in the virtual museums vary from 3D documents of the world heritages to fictional creations (Rothfarb, R. and Doherty, P., 2007).
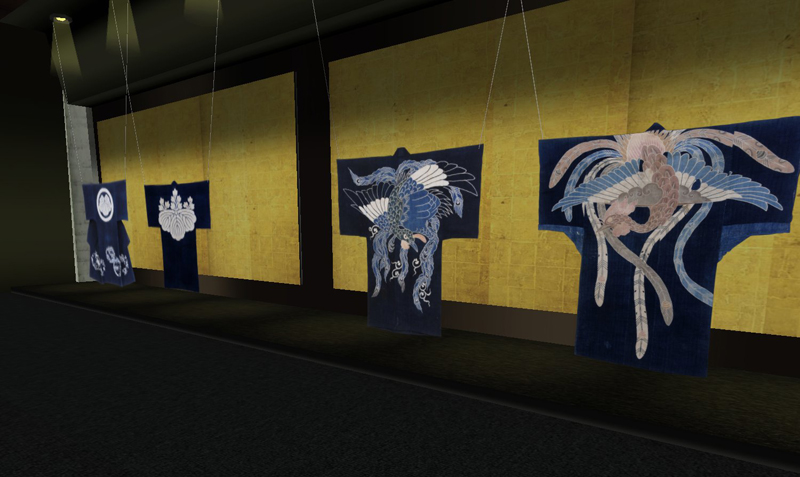
This paper aims at visualization and analysis of visitor behaviors in 3D virtual museums. Without loss of generality, we focused on a museum in Second Life, named Ritsumeikan Digital Archive Pavilion (RDAP) as shown in Figures 1-2. The museum was used in this paper for developing a prototype of our visualization and analysis tool. Efficient visualization of the user movement is very useful for analyzing his/her behaviors, in an implicit manner, in order to extract the disclosed information of individuals in the cyberspace.
Applications of the proposed visualization method include the following:
- The curators can design the exhibit space based on the majority of visitors as illustrated in Section 3.
- The storytelling of an individual visitor can be expressed as a sequence of screenshots capturing the most favored exhibits (as described in Fujita, H. et al., 2008).
- A guide system can be applied so as to achieve a satisfactory museum tour as introduced by Sookhanaphibarn and Thawonmas.
-
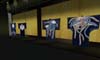
- Figure 1. Kimono exhibition in Ritsumeikan Digital Archive Pavilion (RDAP)
-
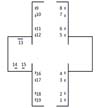
- Figure 2. Floor plan of RDAP with the locations of 19 Kimono objects denoted by a small solid square

Visualization and analysis of visiting patterns
To validate our visualization approach, 36 avatars’ movements in RDAP were synthesized for obtaining four visiting styles. These styles, based on the metaphor of animal behavior, are ant, fish, grasshopper, and butterfly styles as follows (Veron, E. & Levasseur, M., 1983; Chittaro, L., 2004):
- The ant visitors spend quite a long time to observe all exhibits and walk close to exhibits, but avoid empty spaces.
- The fish visitors prefer to move to and stop over at empty spaces, but avoid areas near exhibits.
- The grasshopper visitors spend a long time to see selected exhibits, but ignore the rest of exhibits.
- The butterfly visitors observe almost exhibits, but spend varied times to observe each exhibit.
Local Visualization
Tracing the user movement in Second Life was achieved by using the provided Linden Second Life script, named sensor function. The sensor function detects and reports the user position (x,y) within the particular range. It repeats every particular time interval. In this paper, the considered data consist of the three dimensional positions of an individual visitor and their corresponding time spent.
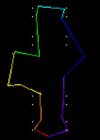
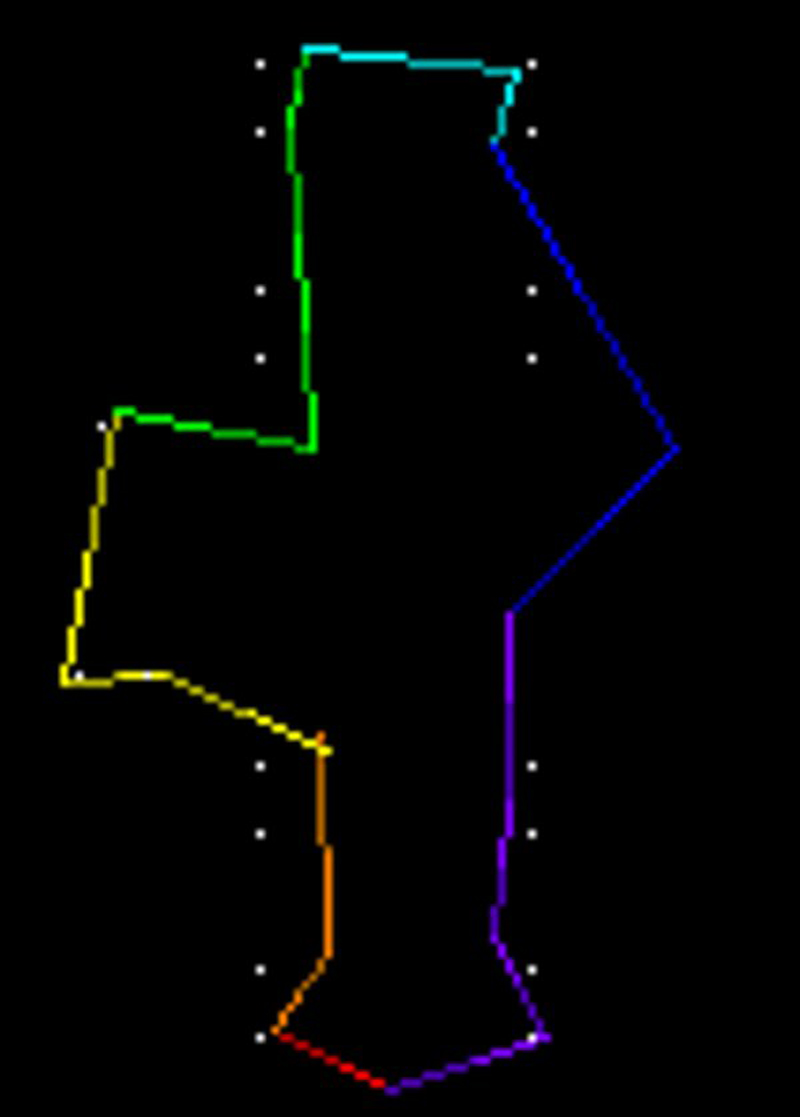
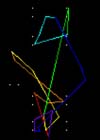
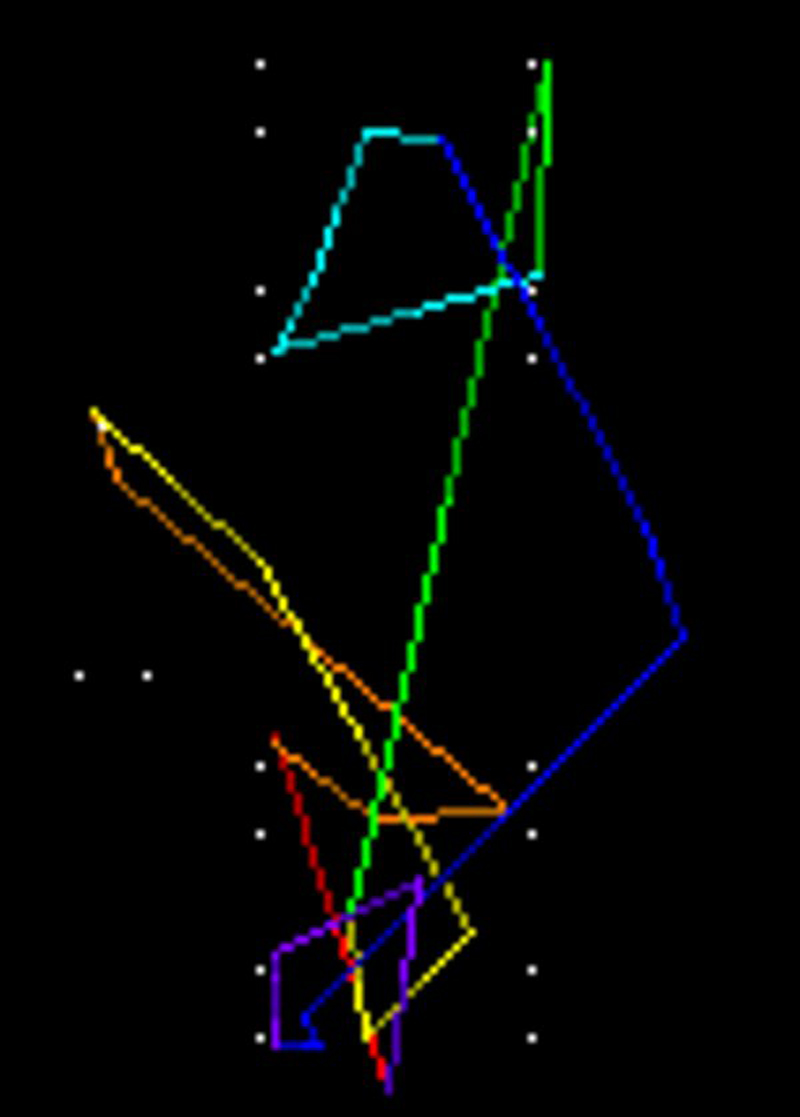
Figure 3 shows four visiting paths in RDAP. The visualization consists of line segments and white dots. A colored line segment is a part of the avatar movement. A white dot represents the location of a Kimono object.
The avatar’s path is displayed with the spectrum colors containing red, orange, yellow, green, cyan, blue, and violet. A path is in the form of connecting segments from red to violet. The session is equally divided in time into 7 periods in the ascending order from red to violet. The color of a particular segment indicates the passage of time.
The length of a segment inversely represents the time spent. For example, the avatar as shown in Figure 3 (a) spent the longest time in the first period recognizable from the shortest red segment. The avatar started moving faster during the last two periods as denoted by longer blue and violet. In our visualization, the shorter a segment is, the longer an avatar spends time in that particular area.
Absent colors show that a longer time was spent than one period. For example, no red and orange segments are shown in Figure 3 (b) because the avatar spent time from the first period to the third near the entrance denoted by the yellow area. If an avatar spends too much time at a particular position exceeding the period length, then the color corresponding to that period will be skipped.
-
- (a) Ant visiting style
-

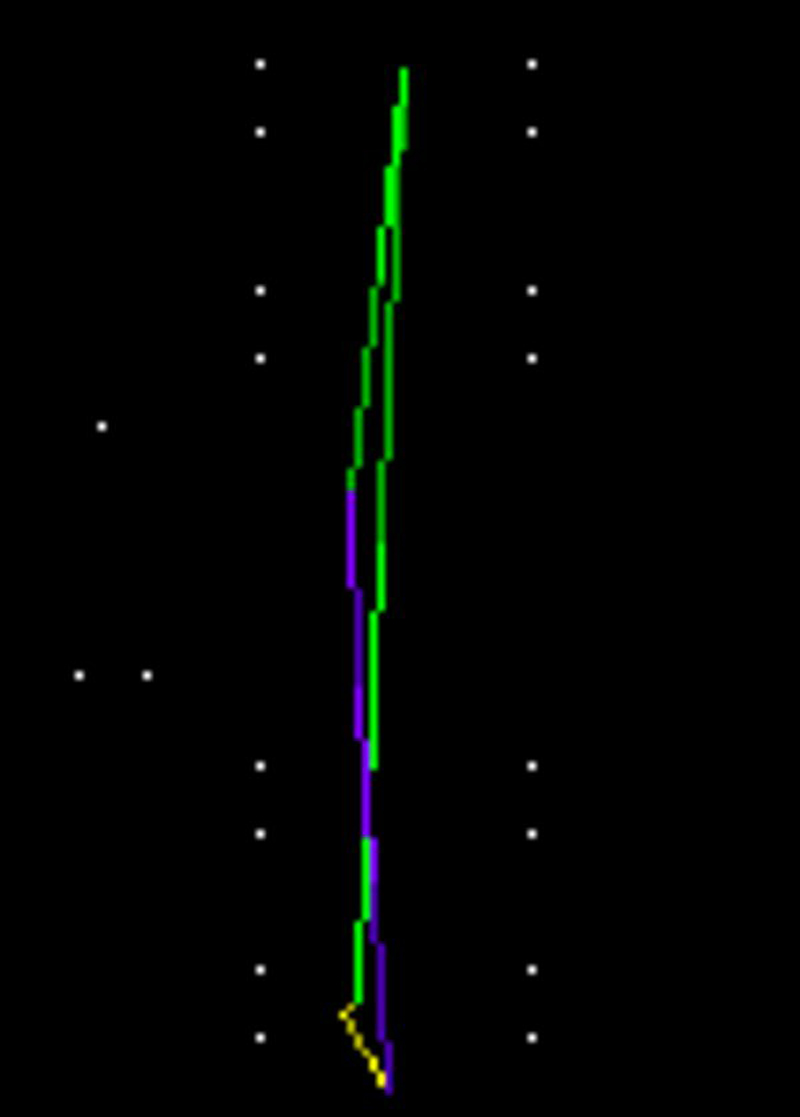
- (b) Fish visiting style
-
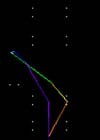
- (c) Grasshopper visiting style
-
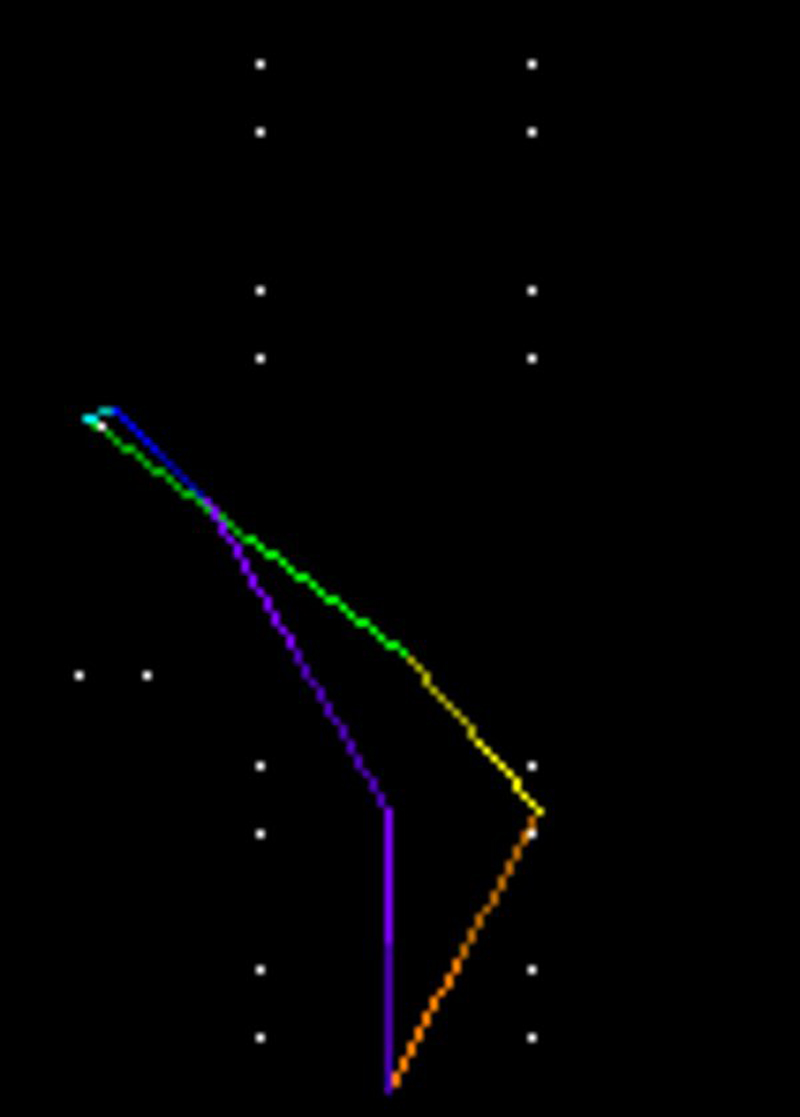
- (d) Butterfly visiting style
Figure 3: Visualization of four visiting styles in RDAP. These color figures will be provided in URL below. http://www.ice.ci.ritsumei.ac.jp/~kingkarn/
Analysis
Our visualization approach can describe the aforementioned visiting styles. Ant, Fish, Grasshopper, and Butterfly visiting styles are displayed on totally different vivid graphic graphs. Hence, our tool is useful for distinguishing the visiting types.
The Ant visiting style is shown in Figure 3 (a). The avatar’s path was along the white dots. It means that the visitor walked close to Kimono objects in order to look at them in detail. The path contained its segments of nearly equal length, indicating that the visitor spent his/her time with the exhibits almost equally.
The Fish visiting style is shown in Figure 3 (b). The avatar’s path was limited to the empty space between two exhibit rows. It means that this visitor preferred to stroll to take the atmosphere of the gallery. Most segments far from the white dots depict that the avatar did not pay attention to the Japanese art imposed on Kimonos. The Grasshopper visiting style is shown in Figure 3 (c). The avatar’s path was drawn as a triangle polygon having the smaller area than that of the Ant style. Its segments represent a kind of diagonally walking across the gallery to the interesting exhibits.
The Butterfly visiting style is shown in Figure 3 (d). The avatar’s path was the longest path of the four styles. Its segments show plenty of diagonally walking across the gallery to most exhibits. The diagonal segment does not imply his/her preference, but this unorganized visit does not follow a well structured sequence like the Ant.
Global Visualization
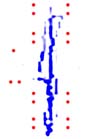
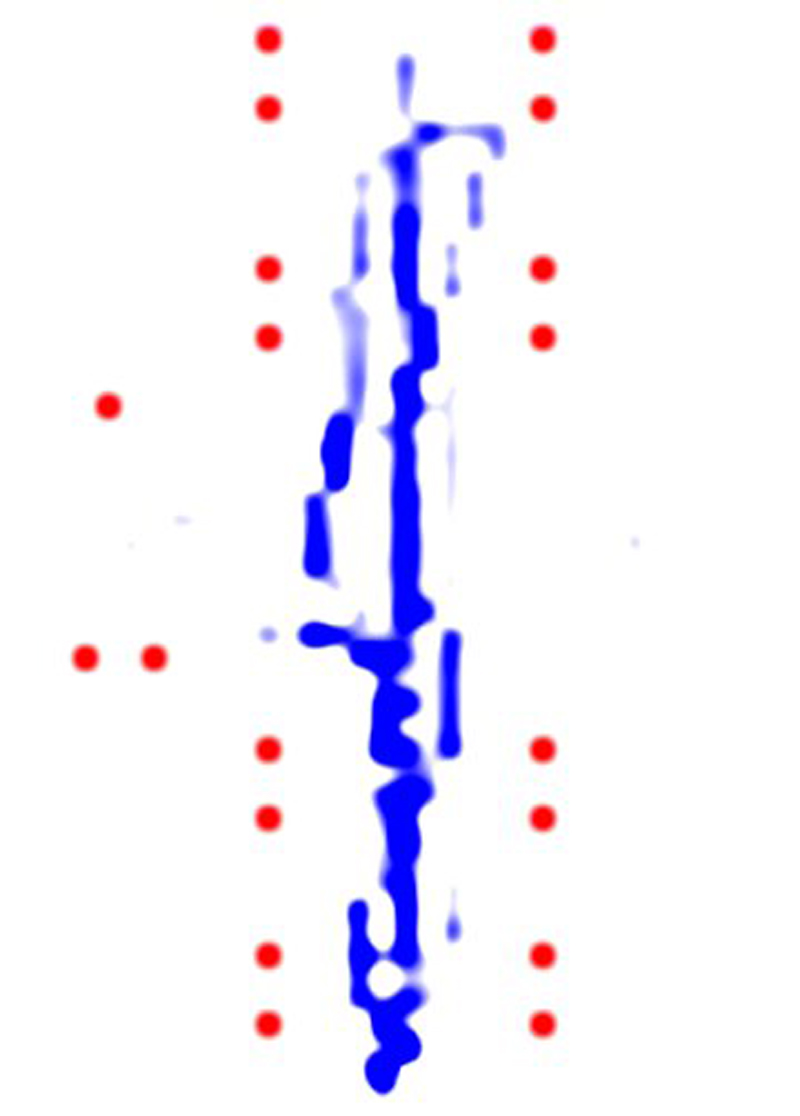
The global visualization of all visitors in each category is displayed in Figure 4. The methodology of this global visualization consists of
- visiting style identification,
- trace accumulation of all users belonging to the same visiting style, and
- contrast enhancement in order to highlight the most popular route.
Using the synthesized data of 36 visitors, the global visualization of each visiting style can guide curators to rotate the museum items and arrange the sequence of items. Table 1 summarizes the interesting or skipped items associated with the visiting styles. An interesting item (I) can be determined if its observation area is darkened; otherwise, the item (S) is considerably ignored. The item numbers are those assigned in Figure 2.
Curators can design an efficient exhibition based on the majority of visitors. It is assumed that our museums consist of four rooms each of which the majority of visitors are ant, fish, grasshopper and butterfly, respectively.
- The ant room: the 13th item is possibly not related to others; therefore, a new one should be substituted.
- The fish room: the visitors prefer to pass slowly through the room. Therefore, all exhibits should be placed along both sides of the main path. The exit should be on either side of the entrance to prevent congestion.
- The grasshopper room: half of the items are possibly not visitor attraction for busy people; on the other hand, they are perhaps varying and unrelated. Therefore, the curators should be re-design the exhibition room; in addition, the skipped items should be replaced with others more related to those visited.
- The butterfly room: the visit routes should be unorganized; therefore, the sequence of exhibits should be rearranged and some skipped items should be replaced/removed, accordingly.
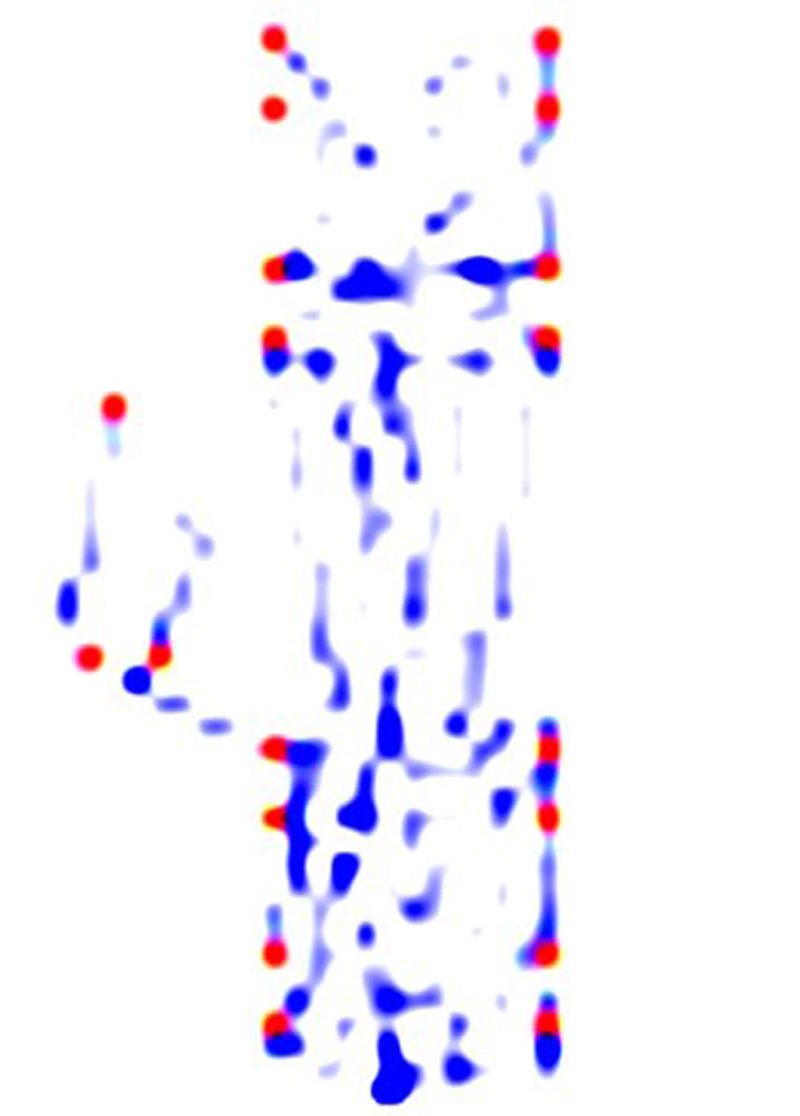
-
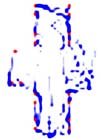
- (a) Common paths of ant visitors

-
- (b) Common paths of fish visitors
-
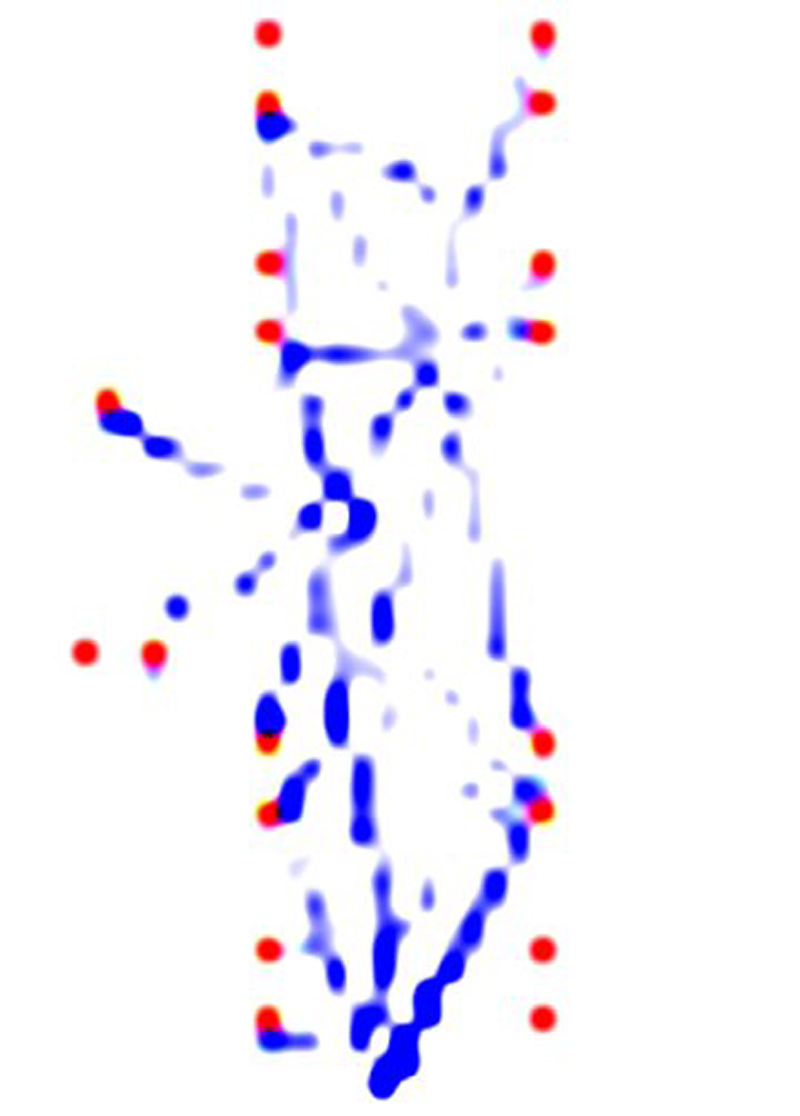
- (c) Common paths of grasshopper visitors
-
- (d) Common paths of butterfly visitors
Figure 4. Visualization of common paths based on four visiting styles, each of a group of seven visitors. Kimono exhibits and the user’s paths are denoted by red dots and blue lines. The color intensity indicates the frequency of visits. The darker blue the visualization shows, the more visitors spend time at that particular area.
| Items | Ant | Grasshopper | Butterfly |
|---|---|---|---|
| 1 | I | S | I |
| 2 | I | S | I |
| 3 | I | I | I |
| 4 | I | I | I |
| 5 | I | I | I |
| 6 | I | S | I |
| 7 | I | I | I |
| 8 | I | S | I |
| 9 | I | S | I |
| 10 | I | I | S |
| 11 | I | S | I |
| 12 | I | I | I |
| 13 | S | I | S |
| 14 | I | S | I |
| 15 | I | S | I |
| 16 | I | I | I |
| 17 | I | I | I |
| 18 | I | S | S |
| 19 | I | I | I |
References
- Urban, R., Twidale, M.B. and Marty, P.F. (2007). 'Second Life for Museums and Archeological Modeling'. Digital Humanities 2007, Conference Abstracts Book. http://www.digitalhumanities.org/dh2007/abstracts/xhtml.xq?id=254 (accessed 15 Nov 2009)
- Rothfarb, R. and Doherty, P. (2007). 'Creating Museum Content and Community in Second Life'. Museums and the Web 2007: Proceedings. J. Trant and D. Bearman (ed.). Toronto: Archives & Museum Informatics. http://www.archimuse.com/mw2007/papers/rothfarb/rothfarb.html (accessed 3 August 2009)
- Fujita, H. and Arikawa, M. (2008). 'Animation of Mapped Photo Collections for Storytelling'. IEICE Trans. INF & SYST. Vol. E91-D, No. 6: 1681-1692
- Sookhanaphibarn, K. and Thawonmas, R. (2009). 'A Movement Data Analysis and Synthesis Tool for Museum Visitors’ Behaviors'. Lecture Notes in Computer Science. Subseries of Information Systems and Applications, incl. Internet/Web, and HCI. Vol. 5879: 144-154
- Veron, E. & Levasseur, M (1983). Ethnographie de l'exposition. L'espace, le corps et le sens. Paris: Bibliothque publique d'Information. Centre Georges Pompidou
- Chittaro, L. and Leronutti, L. (2004). 'A Visual Tool for Tracing Users’ Behavior in Virtual Environments'. Proceedings of the Working Conference on Advanced Visual Interfaces, AVI’04 ACM. Pp. 40-47
© 2010 Centre for Computing in the Humanities
Last Updated: 30-06-2010