Digital Humanities
DH2010
King's College London, 3rd - 6th July 2010
How Do You Visualize a Million Links?
See Abstract in PDF, XML, or in the Programme
Brown, Susan
University of Alberta and University of Guelph,
English
susan.brown@ualberta.ca
Antoniuk, Jeffery
University of Alberta, Orlando Project
jeffery.antoniuk@ualberta.ca
Bauer, Michael
University of Western Ontario, Computer Science
bauer@uwo.ca
Berberich, Jennifer
University of Western Ontario, Computer Science
jenn_b19@hotmail.com
Radzikowska, Milena
Mount Royal College , Communications
mradzikowska@gmail.com
Ruecker, Stan
University of Alberta, Humanities Computing
sruecker@ualberta.ca
Yung, Terence
Mount Royal College , Communications
terence.yung@zerom3.com
In the past quarter century, established methods of literary history have been severely contested. On the one hand, syncretic, single-author histories have become problematic as a result of a combination of the expanded literary canon and a range of theoretical challenges. On the other, a demand for historicized overviews that reflect the radical recent reshaping in all fields of literary study has produced large numbers of both collectively written histories and encyclopedias or companions. Literary history thus tends towards compilations in which specialists treat their particular fields, at the cost of integration or of coherence. Meanwhile, the primary materials are increasingly available in digital form, and literary historical scholarship itself is increasingly produced digitally, whether as versions of established forms such as journal articles, or in resources that invoke the potential for new kinds of analysis. Major digital initiatives over the past decades have focused almost exclusively on digital resource creation: the increasingly pressing question is how to use this expanding body of materials to its fullest potential.
In this project, we investigate how literary historical analysis can be extended using various forms of visualization, using the experimental Orlando Project as our test bed. Orlando: Women's Writing in the British Isles from the Beginnings to the Present is recognized as the most extensive and detailed resource in its field and as a model for innovative scholarly resources. Composed of 1,200 critical biographies plus contextual and bibliographical materials, it is extensively encoded using an interpretive Extensible Markup Language (XML) tagset with more than 250 tags for everything from cultural influences, to relations with publishers, or use of genre or dialect. The content and the markup together provide a unique representation of a complex set of interrelations of people, texts, and contexts. These interrelations and their development through time are at the heart of literary inquiry, and having those relations embedded in the markup, and hence processable by computer, offers the opportunity to develop new forms of inquiry into, and representations of, literary history. Such new opportunities of scale are often invoked using Greg Crane’s seminal question, “What can you do with a million books?” (2006).
We need to be able to ask big, complex questions while remaining grounded in particularities, and we need new ways of representing answers to those questions. This requires new tools for scholarly research that can access, investigate, and present new aspects of the human story and history. In this context, we contend that the scholarly interface requires not only experimentation but also careful assessment to see what works to make digital materials of real value to humanities scholars. As argued by Ramsay (2003), Unsworth (2006), and others, using computers to do literary research can contribute to hermeneutic or interpretive inquiry. Digital humanities research has inherited from computational science a leaning towards systematic knowledge representation. This has proved serviceable in some humanities activities, such as editing, but digital methods have far more to offer the humanities than this. As Drucker and Nowviskie have argued, “The computational processes that serve speculative inquiry must be dynamic and constitutive in their operation, not merely procedural and mechanistic” (431).
The Orlando encoding system, devised for digital rather than print textuality, facilitates collaboratively-authored research structured according to consistent principles. The encoding creates a degree of cross-referencing and textual inter-relation impossible with print scholarship—not simply hyperlinking but relating separate sections of scholarly text in ways unforeseen even by the authors of the sections. It represents a new approach to the integration of scholarly discourse, one which allows the integrating components to operate in conjunction with, rather than in opposition to, historical specificity and detail (Brown et al. 2006c). However, the search-and-retrieval model of the current interface for Orlando, while user-friendly in that it resembles first-generation online research tools, cannot exploit this encoding to the fullest. Search interfaces only find what the user asks for, whereas visualization enables exploration and discovery of patterns and relationships that one might not be able to search for.
For instance, the current interface permits users to search for authors by the number of children they had, and thus to explore the relationship between literary production and reproduction. The quantity of material in Orlando makes it difficult to see overall patterns amongst the results. Recent experiments with the Mandala browser have demonstrated that visualization permits one to see both interesting anomalies (e.g. in lives which have demanded the use both of the childlessness tag and the children tag), and larger patterns, such as the non-correlation between high literary productivity and childlessness or small family size (Brown et al. 2008). These preliminary investigations confirm Moretti’s argument (2005) that visual representations enable kinds of literary historical inquiry that are not supported by conventional search interfaces. Orlando has the added advantage of making it possible to dive back into the source material to see the specifics from which the representation is produced.
In addition to the Mandala experiments, we have also been working on a set of designs for visually summarizing relationships in a manner that allows interactive exploration (e.g. Fig. 1). Building on the large body of previous literature in network visualization (e.g. Barabási 2002; Watts 2003; Christakis and Fowler 2009), we are experimenting with new visual representations for networks of people.
-
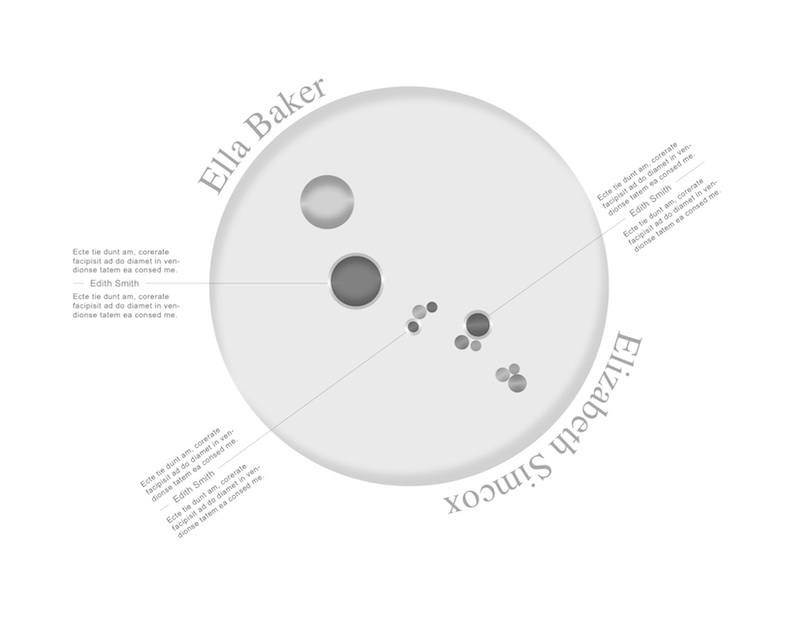
- Fig. 1: One of several concepts for summarizing relationships among authors in Orlando. Here the authors on the path of connection are shown as coloured circles, where size is frequency and a unique colour is assigned to each author.
Interviews and observations of users at a recent hackfest provided some excellent insights into the sorts of interfaces that are likely to appeal to users wanting to explore embedded relationships in a body of texts in an open-tended way. While point-to-point visualization was considered to have some value, more excitement was generated by open-ended interface sketches, such as a visualization that resembles a cityscape, even when these were much less representational than conventional interfaces for the humanities.
At the same time, Brown and Bauer have been working on a visualization tool that illustrates the challenges facing the project of representing all of Orlando’s semantically interrelated data through a graphical representation based on nodes and edges. It highlights the difficulty of providing prospect when dealing with a large and complexly structured data set, since the full set of relationships even of a moderate subset of the 1200 writers becomes unreadable, with over 16 million edges in the graph. We have done some work to explore algorithms and interfaces to accommodate these large data spaces and multitudes of relationships and tags. The challenge is to provide the researcher with a means of perceiving or specifying subsets of data, extracting the relevant information, building the nodes and edges, and then providing means to navigate the vast number of nodes and edges, especially given the limited amount of space on a computer monitor. The figures below illustrate some of the aspects of the tool.
-
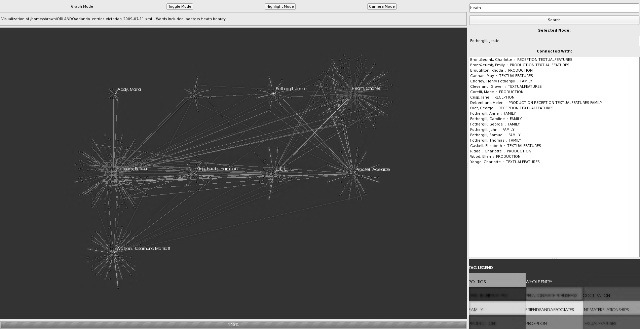
- Fig. 2: several writers and their interconnections
-
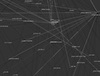
- Fig. 3: zoomed view of relationships
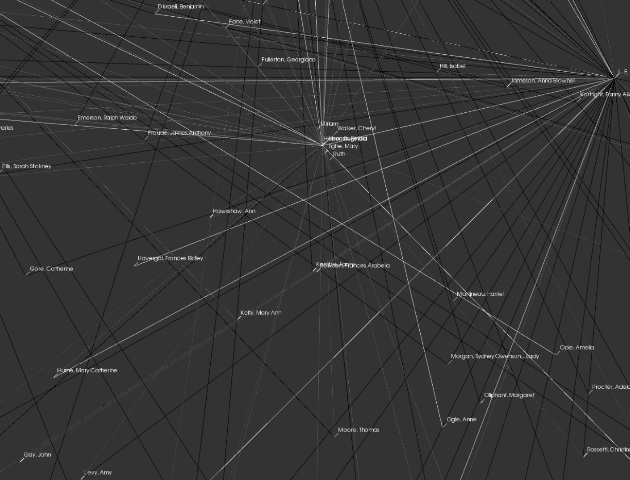
The nodes (at the centre of the starbursts) represent writers, while the blue dots show other individuals (Fig. 2). The edges are shown as differently colored lines indicating different kinds of relationships as determined by tags (identified in the colored boxes). A researcher can display names, hide certain edges by deselecting tags, and zoom in and move around a large graph of nodes and edges (Fig. 3). The tool is a starting point for evaluating existing computational approaches and graphical displays of relationships as a means of exploring literary questions. It raises exciting questions regarding the integration of data mining approaches with a graphical interface, particularly for scholars suspicious of abstractions. Computationally, the question of how to make such a tool accessible to remote users is a challenge.
This paper will compare the various approaches to visualizing links that we have employed to date on this data, and reflect on them in relation to both the literature on visualization approaches and our user feedback as a means of advancing our thinking on the challenge of creating interfaces for exploring large numbers of interlinkages within or between humanities resources.
References
- Barabási, Albert-Lászlo (2002). Linked: The New Science of Networks. Cambridge, MA: Perseus Publishing
- Brown, Susan, Clements, Patricia, Grundy, Isobel, Ruecker, Stan, Antoniuk, Jeffery, Balazs, Sharon, Sinclair, Stéfan and Patey, Matt (2008). 'Beyond Text: Using the Mandala Browser to Explore Orlando'. Society for Digital Humanities (SDH/SEMI) Meeting. Congress of the Humanities and Social Sciences Federation of Canada. University of British Columbia (June 2008)
- Brown, Susan, Clements, Patricia and Grundy, Isobel (2006c). 'Scholarly Introduction'. Orlando: Women’s Writing in the British Isles from the Beginnings to the Present. Cambridge: Cambridge University Press. http://orlando.cambridge.org/public/svDocumentation?formname=t&d_id=ABOUTTHEPROJECT
- Crane, G. (2006). 'What do you do with a million books?'. D-Lib magazine. V. 12. 3
- Drucker, J. and Nowviskie, B. (2004). 'Speculative computing: Aesthetic provocations in humanities computing'. A Companion to Digital Humanities. Schreibman, Susan, Siemens, Ray and Unsworth, John (eds.). Oxford: Blackwell, pp. 431-447
- Christakis, Nicholas A. and Fowler, James H. (2009). Connected: The Surprising Power of Social Networks and How They Shape Our Lives. New York: Little, Brown and Company
- Moretti, F. (2005). Graphs, Maps, Trees: Abstract Models for a Literary History. London: Verso
- Ramsay, Stephen (2003). 'Toward an Algorithmic Criticism'. Literary and Linguistic Computing. V. 18. 2
- Unsworth, John (2005). 'New methods for humanities research'. Lyman Award Lecture. National Humanities Center Research Triangle Park, NC (11 November 2005). http://www3.isrl.illinois.edu/~unsworth/lyman.htm
- Watts, Duncan J. (2003). Six Degrees: The Science of a Connected Age. New York: W. W. Norton & Company
© 2010 Centre for Computing in the Humanities
Last Updated: 30-06-2010