Digital Humanities
DH2010
King's College London, 3rd - 6th July 2010
Mapping the World of an Ancient Greek Historian: The HESTIA Project
See Abstract in PDF, XML, or in the Programme
Barker, Elton
Open University, UK
e.t.e.barker@open.ac.uk
Pelling, Chris
University of Oxford, UK
chris.pelling@chch.ox.ac.uk
Bouzarovski, Stefan
University of Birmingham, UK
BuzarS@adf.bham.ac.uk
Isaksen, Leif
University of Southampton, UK
l.isaksen@soton.ac.uk
HESTIA (the Herodotus Encoded Space-Text-Imaging Archive) is an interdisciplinary project, sponsored by the AHRC and involving the collaboration of academics from Classics, Geography and Archaeological Computing, that aims to enrich contemporary discussions of space by developing an innovative methodology to the study of an ancient narrative, Herodotus’ Histories. Using the latest ICT, it investigates the ways in which space is represented in the Histories, and develops visual tools to capture the ‘deep’ topological structures of the text, extending beyond the usual two-dimensional Cartesian maps of the ancient world. In addition to exploring the network culture that Herodotus represents, one of its stated outcomes is to introduce Herodotus’ world to new audiences via the internet. This paper will set out in more detail that methodology, paying particular attention to the decisions that we have made and the problems that we have encountered, in the hope that our project can contribute not only to offering a more complex picture of space in Herodotus but also to establishing a basis for future digital projects across the humanities which deal with large text-based corpora.
For the purposes of a twenty minute presentation, we address three key areas of interest:
- To provide the background to the data capture and digital mark-up of the Histories. Our project differs from many by utilizing a digital resource already in the public domain: the text of Herodotus freely available from Perseus (http://www.perseus.tufts.edu/hopper/). Though the capture of the digital text from Perseus (version P4) gave our project a welcome initial boost, a number of issues have had to be overcome including procedural conversion, which involves handing back a P5 text to Perseus.
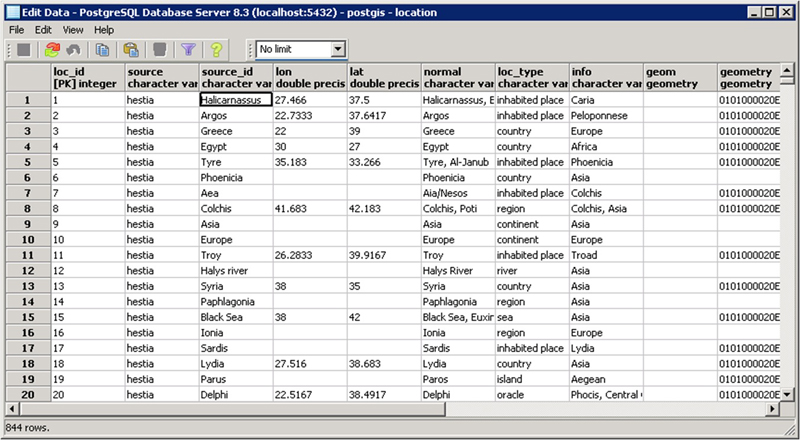
- To sketch out the the type, structure and categorization of our spatial database. A PostgreSQL database was chosen because its PostGIS extension provides excellent functionality for spatial data and is widely supported by other applications: one key principle of HESTIA has been to use open source software in order to maximize its potential dissemination and reusability of its data. By storing information about references, locations and the text in the database, it has been possible to provide it to both a Desktop GIS system and Webmapping server simultaneously (see figure 1).
- To present a sample set of results of the maps that we have been able
to generate using the geo-referenced database. While sections 1 and 2
will be of particular concern to anyone wishing to understand how one
may interrogate spatial data using the digital resources available, this
last stage holds the greatest interest for the non ICT expert since it
demonstrates the use to which data in this form can be employed: hence
the main focus of this paper will be on explaining the five kinds of map
that we have been able to generate:
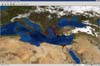
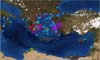
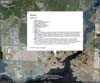
- Geographical Information System (GIS) maps. The most basic maps that are generated simply represent a ‘flat’ image of the spatial data: that is to say, they mark all the places that Herodotus mentions over the course of his work with a single point, thereby providing a snapshot of the huge scope of his enquiry. In this way one is able to gain an overview of the places mentioned in Herodotus and divide them according to three different kinds of spatial category: settlement, territory and physical feature (see figure 2). A variation on this basic model depicts places according to the number of times they are mentioned (see figure 3).
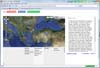
- GoogleEarth. In order to start experimenting with public dissemination it was decided to expose the PostGIS data as KML: a mark-up format that can be read by a variety of mapping applications including GoogleEarth. With this ‘Herodotus Earth’ application, users will be able to construct ‘mashups’ of visual and textual data. So, for example, since all places are linked to entries in the database, when one clicks on a particular location in GoogleEarth, it will be possible to bring up a dialog box containing Herodotus’ text (in both English and Greek) for that particular location for every occasion when it is mentioned in the narrative (see figure 4).
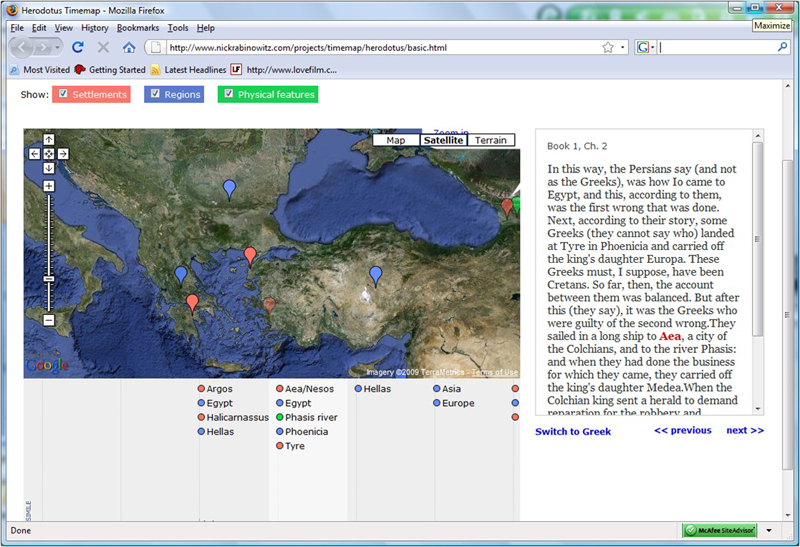
- TimeMap. Whilst it is possible to visualise narrative change using graphs, and static differences using GIS, it is more difficult to visualize spatial changes throughout the narrative; GIS does not have useful functionality in this regard except for the ability to turn layers on and off, a process which becomes impractical beyond book level. The most likely candidate to provide this kind of functionality is an Open Source JavaScript project called TimeMap, developed by Nick Rabinowitz, which draws on several other technologies in order to allow data plotted on GoogleMaps to appear and disappear as a timeline is moved. In collaboration with the project’s IT consultant Leif Isaksen, Nick Rabinowitz has adapted his schema in order to represent the book structure of Herodotus’ narrative in a similar way (see figure 5).
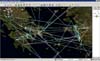
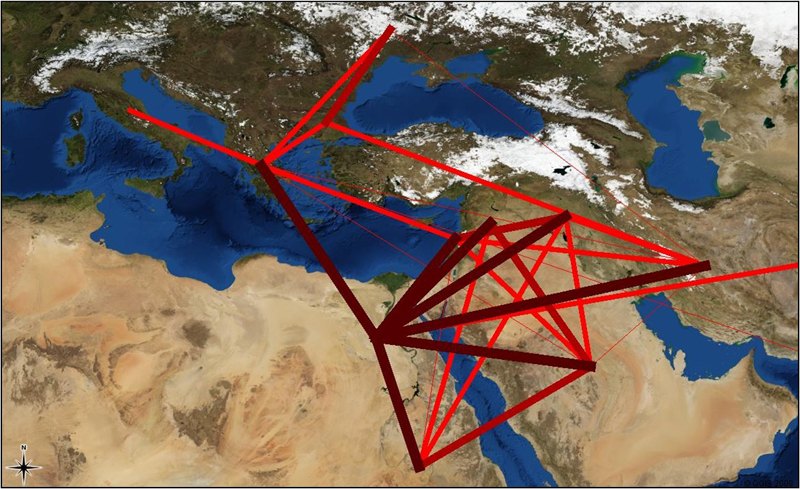
- Database-generated network maps. Since the GIS maps outlined in i. have little to say per se regarding Herodotus’ organization of space, a key next step has been to explore rapidly-generated networks based on the simple co-presence of terms within sections of the text. The purpose of producing networks of this kind is to start exploring the connections that Herodotus himself makes between places, seeing how strongly the narrative is bound to geographical regions, and flagging up potential links between particular locations (see figure 6). Figure 7 illustrates one such simple network, that for “territories” across the entire Histories. It shows a series of links connecting Greece to other areas within the Mediterranean world: but the territory that has the strongest connections in this basic network culture is Egypt. While surprising, it does make sense on reflection, since for a better part of one book Herodotus uses Egypt as the touchstone against which other cultures, including Persia and his own, Greece, are compared. It is as a tool of comparison, then, that Egypt appears to be the centre of Herodotus’ network picture of the Mediterranean. Figure 8 complements this picture by presenting the networks of physical features, which envelop the comparison between Greece and Egypt.
- Manual network maps. The automated maps outlined in iv. rely on ‘counting’ the number of times two or more places are connected to each other: they have little to say about the kind of connection being drawn. We end our presentation, then, with a brief comparison to text-based qualitative analysis, which attempts to categorize relationships according to fundamental geographical concepts of movement or transformation, based on the close reading of one book (5). Our different approaches are intended to complement, challenge and inform each other with a view also to suggest ways by which the automated process may be extended, such as by adopting text-mining procedures.
In sum, this paper aims to meet three outcomes:
- To outline a methodology for dealing with digital data that may be transferred, adapted and improved upon in other fields of digital humanities.
- To demonstrate the value of digital projects within the humanities for helping to achieve ‘impact’ by bringing the world of a fifth-century BC Greek historian into everyone’s home.
- To show the potential for the digital manipulation of data in posing new kinds of research questions.
-
- Fig. 1
-
- Fig. 2

-
- Fig. 3

-
- Fig. 4

-
- Fig. 5
-
- Fig. 6

-

- Fig. 7
-
- Fig. 8

References
- Berman, M. L. (2005). 'Boundaries or Networks in Historical GIS: Concepts of Measuring Space and Administrative Geography in Chinese History'. Historical Geography. 33: 118-33
- Crampton, J.W. and Krygier, J. (2006). 'An introduction to critical cartography'. ACME: An International E-Journal for Critical Geographies. 4: 11-33
- Harley, J.B. (1989). 'Deconstructing the map'. Cartographica: The International Journal for Geographic Information and Geovisualization. 26.2: 1-20
- Horden, J. and Purcell, N. (2000). The Corrupting Sea. Oxford
- Jackson, P. (1994). Maps of Meaning: An Introduction to Cultural Geography. London
- Janni, P. (1984). La Mappa e il Periplo. Cartografia antica e spazio odologico. Marcerata
- Kwan, M.-P. and Ding, G. (2008). 'Geo-Narrative: Extending Geographic Information Systems for Narrative Analysis in Qualitative and Mixed-Method Research'. The Professional Geographer. 60.4: 443-65
- Lefebvre, H. (1991). The Production of Space. Chicago
- Lloyd, C. D. and Lilley, K. D. (2009). 'Cartographic Veracity in Medieval Mapping: Analyzing Geographical Variation in the Gough Map of Great Britain'. Annals of the Association of American Geographers. 99.1: 27-48
- Purves, A. C. (2002). Telling Space: Topography, Time and Narrative from Homer to Xenophon. University of Pennsylvania
- Romm, J.S. (1994). The Edges of the Earth in Ancient Thought: Geography, Exploration, and Fiction. Princeton
- Sheppard, E. (2005). 'Knowledge Production through Critical GIS: Genealogy and Prospects'. Cartographica: The International Journal for Geographic Information and Geovisualization. 40.4: 5-21
- Tuan, Y.-F. (1978). 'Literature and geography: implications for geographical research'. Humanistic Geography. Ley and Samuels (eds.). London, pp. 194-206
© 2010 Centre for Computing in the Humanities
Last Updated: 30-06-2010